

Reflection on My 2019 Posts So Far
As I have mentioned before, one of my resolutions was to publish an article every Tuesday. With 26 installments out we are now halfway through the year. In the data driven spirit of this blog, let us have a look at how they have fared.
First of all, let us take a look at the cumulative amount of hours that people have spent reading my posts. Reading time is calculated by multiplying the number of reads of each article by its average “reading time”; this is generally three minutes or so. If you are wondering where that jump comes from, this is when my post about Chandler being a data scientist got picked up by Google’s suggested content algorithm, resulting in 300+ hours of extra reading time.
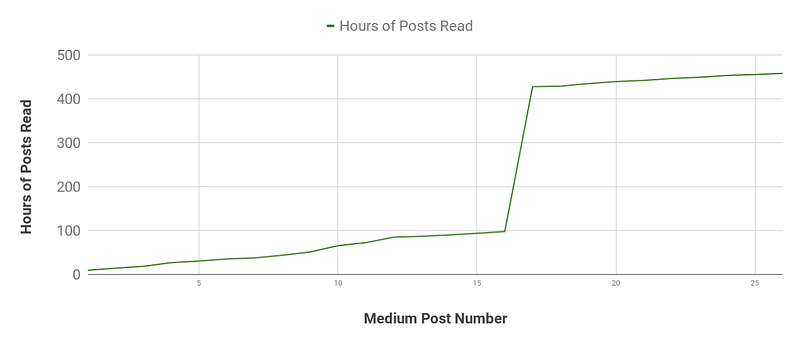
If you are wondering if that line is flattening out, it sure does look that way. This could be explained by various factors. Are less people who view my posts taking the time to read them? Actually, no. The ratio of reads on Medium to views on Medium is holding constant around 66%. While interesting that one in three people who land on a post of mine decide they made a mistake and bail, this does not explain the overall trend. Maybe looking at the amount of traffic I get from LinkedIn will help, as it is my largest source of readers.
To clarify, the LinkedIn Post Views are the amount of views I got on each of my LinkedIn posts sharing the link to the weekly article, usually in the feed. Given it is an outlier, I have excluded the Chandler Medium post in this chart.
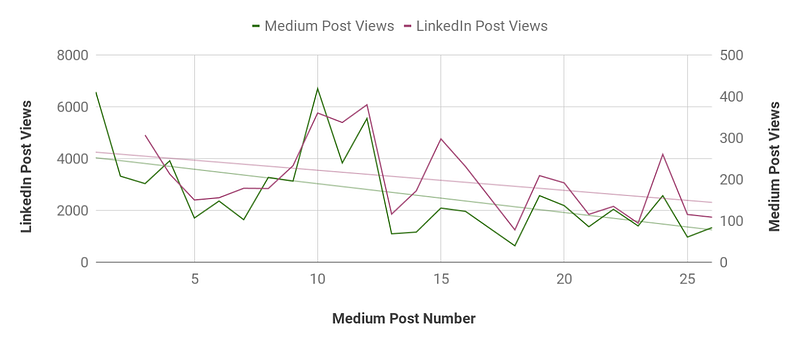
Well, this does not lot good. I am obviously very dependent on LinkedIn to send my Medium blog traffic (a Pearson correlation coefficient of 0.83) and with the LinkedIn post views declining, so are the amount of views I am getting on my Medium posts. As you can see I have added in two trend lines to underscore the point. At this rate I will have no readers left by year’s end! Yet hope may be on the horizon as LinkedIn is changing its content algorithm. Additionally, as a bit of an experiment I will post my next set of articles on LinkedIn directly, to see how that impacts my readership. Time for science!
Finally, given that I like a good metric, I defined an engagement score based on a Medium post’s readership and its associated amount of likes and click-through rate on LinkedIn. I have excluded the Chandler outlier once more. Even though this is an utterly arbitrary measure, you can still see that there are several posts that did less well than the other ones. Which ones are they?
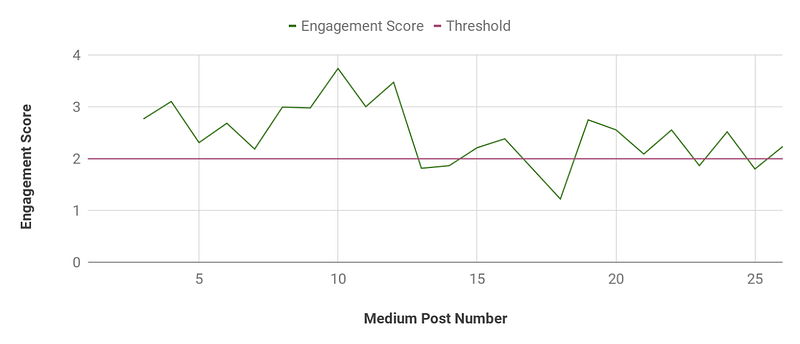
Here is the overview of everything I have written so far this year. The five items in bold are the ones that got significantly less love than the others. I am not sure whether this is because they are badly written, not relevant, or just unlucky. Please do give them a look and let me know. Thank you for reading!
#1 Have Data, Want Impact
#2 Mission Over Task
#3 Why You Should Care about Analytics
#4 Analytics Value Chain: Insights to Action
#5 Navigating Data & Analytics Technologies
#6 Starting with the Right Question
#7 Bias, Diversity, and Profitability
#8 Zero to Impact in a Week
#9 Choosing Metrics that Matter
#10 Data Visualisation: No Tools Required
#11 Reflection on My First Ten Posts
#12 Bad Questions and Sad Analysts
#13 When Familiarity Fails Us
#14 Everything is New and Different. Is it?
#15 Teenagers: Data is the Career For You
#16 Data Quality: You Are What You Eat
#17 The One Where Friends’ Least Popular Character Ended Up with the Sexiest Job of the 21st Century
#18 How Long Will Human in the Loop Decision Making Remain Responsible?
#19 Data Visualisation for Drunks
#20 Unicorn Farming: Building Capabilities Against the Odds (Part I)
#21 Unicorn Farming: Building Capabilities Against the Odds (Part II)
#22 Data Leaders: It is Not Who You Report To, but Who You Report To
#23 In Analytics, Look Beyond Last Mile and Think Last Twenty Nanometers
#24 Yes, Machine Learning is Cool. But is Your Organisation Ready Yet?
#25 Appropriate Intelligence: Responsibly Applying AI in the Real World
#26 The Hidden Blocker in Delivering Great Analytics Projects: Empathy
— Ryan

Q* - Qstar.ai Newsletter
Join the newsletter to receive the latest updates in your inbox.